mirror of
https://gitee.com/smartchart/smartchart
synced 2025-05-05 00:59:25 +08:00
249 lines
11 KiB
Markdown
249 lines
11 KiB
Markdown
[Wiki](https://gitee.com/smartchart/smartchart/wikis/pages) \|
|
|
[Community](https://www.smartchart.cn/) \|
|
|
[Sponsors](https://www.smartchart.cn/) \|
|
|
[GitHub](https://github.com/JohnYan2017/Echarts-Django) \|
|
|
[Gitee](https://gitee.com/smartchart/smartchart)
|
|
|
|
<p align="center">
|
|
<a href="https://www.smartchart.cn"><img src="https://www.smartchart.cn/media/editor/WechatIMG51_20210117224243671223.png" width="45%"></a>
|
|
</p>
|
|
<p align="center">
|
|
<strong>A platform that Connect Data to Echarts.</strong>
|
|
</p>
|
|
<p align="center">
|
|
<a href="https://www.smartchart.cn">https://www.smartchart.cn</a>
|
|
</p>
|
|
|
|
<p align="center">
|
|
<img src="https://img.shields.io/badge/Release-V5.0-green.svg" alt="Downloads">
|
|
<a target="_blank" href="https://www.python.org/downloads/release/python-390/">
|
|
<img src="https://img.shields.io/badge/Python-3.6+-green.svg" />
|
|
</a>
|
|
<a href='https://gitee.com/smartchart/smartchart/members'><img src='https://gitee.com/smartchart/smartchart/badge/fork.svg?theme=dark' alt='fork'></a>
|
|
<a href='https://gitee.com/smartchart/smartchart/stargazers'><img src='https://gitee.com/smartchart/smartchart/badge/star.svg?theme=dark' alt='star'></a>
|
|
<a target="_blank" href='https://github.com/JohnYan2017/Echarts-Django'>
|
|
<img src="https://img.shields.io/github/stars/JohnYan2017/Echarts-Django.svg?style=social" alt="github star"/>
|
|
</a>
|
|
</p>
|
|
<p align="center">
|
|
<a href="https://qm.qq.com/cgi-bin/qm/qr?k=eC34KwVvEtMvfh8Zyn1RSfYlzZvuvm7i&jump_from=webapi"><img src="https://img.shields.io/badge/QQ群-476715246-orange"/></a>
|
|
<a target="_blank" href="https://www.smartchart.cn">
|
|
<img src="https://img.shields.io/badge/Author-John%20Yan-ff69b4.svg" alt="Downloads">
|
|
</a>
|
|
<a target="_blank" href="https://www.smartchart.cn">
|
|
<img src="https://img.shields.io/badge/Copyright%20-@smartchart.cn-%23ff3f59.svg" alt="Downloads">
|
|
</a>
|
|
</p>
|
|
|
|
-------------------------------------------------------------------------------
|
|
|
|
|
|
|
|
### Introduction
|
|
|
|
- Smartchart is a microcode development platform for data visualization, large screen, mobile report and web applications
|
|
|
|
- Simple, agile, efficient, universal and highly customizable, so that your project can be upgraded instantly
|
|
|
|
- Fully open up the front and back ends, support graphic data linkage, filtering and drilling, and support almost all common databases
|
|
|
|
- The building block development mode supports drag and drop layout, out of the box, simple installation, less dependence, and is suitable for various platforms
|
|
|
|
- Support Django app plug-in application and jupyter data analysis application
|
|
|
|
- Memory acceleration technology makes your data one step faster and greatly reduces the pressure on the database
|
|
|
|
- No repeated learning cost, highly customizable, attention is highly customizable!!
|
|
|
|
|
|
|
|
|
|
|
|
|
|
|
|
### Sample
|
|
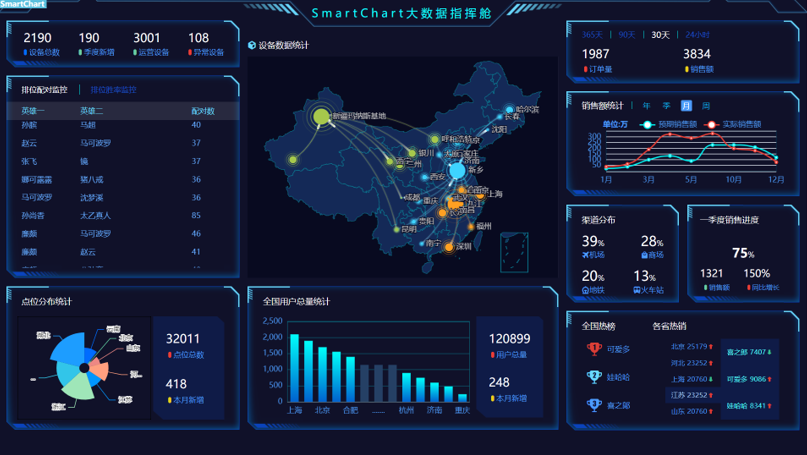
- [smartchart big screen sample - smart city big data big screen](https://www.smartchart.cn/echart/?type=智慧城市_大数据大屏 "大屏样列-智慧城市_大数据大屏")
|
|
- [smartchart integrated datav](https://www.smartchart.cn/echart/?type=Smartchart_DataV "集成DATAV")
|
|
- [smartchart graphics data linkage](https://www.smartchart.cn/echart/?type=评论分析 "图形数据联动")
|
|
|
|
|
|
|
|
### Quick start
|
|
|
|
#### Install Python environment
|
|
|
|
- Environment preparation: Official [latest Python download link](https://www.python.org/downloads/release/python-390/ "Latest Python download link")
|
|
|
|
If the download is too slow, you can go to [Taobao mirror image download](https://npm.taobao.org/mirrors/python/3.9.0/ "Taobao mirror image download")
|
|
|
|
You can also download [windows 64 bit installation version](https://npm.taobao.org/mirrors/python/3.9.0/python-3.9.0-amd64.exe "Windows 64 bit installation version")
|
|
|
|
[Mac computer installation version](http://npm.taobao.org/mirrors/python/3.9.0/python-3.9.0rc2-macosx10.9.pkg "Mac computer installation version")
|
|
|
|
- [window platform installation video introduction](https://www.ixigua.com/6910413586208653837?id=6901867671193649668 "Window platform installation video introduction")
|
|
|
|
**Note: when Windows installs python, you need to select "add to path"**
|
|
|
|
|
|
|
|
#### Installing smartchart
|
|
|
|
```shell script
|
|
|
|
pip3 install smartchart
|
|
|
|
|
|
|
|
If the installation process is slow, it is recommended to use it
|
|
|
|
pip3 install -i https://pypi.tuna.tsinghua.edu.cn/simple smartchart -U
|
|
|
|
|
|
|
|
Upgrade method:
|
|
|
|
PIP3 install smartchart - U (upgrade)
|
|
|
|
```
|
|
|
|
|
|
|
|
[smartchart getting started document entry](https://gitee.com/smartchart/smartchart/wikis/ "Getting started with smartchart")
|
|
|
|
|
|
|
|
|
|
### Application scenario 1:
|
|
|
|
If you are not familiar with Django / python, you only need a visual development platform, which can be started quickly and used independently
|
|
|
|
```shell script
|
|
|
|
Local command line startup:
|
|
|
|
smartchart
|
|
|
|
Or smartcharts (automatically open web pages)
|
|
|
|
If you are a server deployment, remote access, server startup method:
|
|
|
|
smartchart runserver 0.0.0.0:8000 --insecure --noreload
|
|
|
|
```
|
|
|
|
**Administrator account password: admin / Admin, please change the password in time**
|
|
|
|
|
|
|
|
[smartchart getting started document entry](https://gitee.com/smartchart/smartchart/wikis/ "Getting started with smartchart")
|
|
|
|
|
|
|
|
|
|
-------------------------------------------------------------------------------
|
|
|
|
|
|
|
|
### Application scenario 2:
|
|
|
|
If you are a data analysis enthusiast and are using jupyter, pandas and other analysis tools, you can use them as visualization tools
|
|
|
|
**It supports Python drawing tools such as pyecarts and Matplotlib to be used in Jupiter, which is more convenient and cool**
|
|
|
|
**There are only two commands, get and set, which can simplify the data analysis work, solidify the analyzed data and generate a cool dashboard**
|
|
|
|
[getting started with smartchart in jupyter](https://gitee.com/smartchart/smartchart/wikis/6.Jupyter%E5%BA%94%E7%94%A8/%E5%9C%A8Jupyter%E4%B8%AD%E4%BD%BF%E7%94%A8%E6%8C%87%E5%BC%95 "Getting started using smartchart in Jupiter")
|
|
|
|
|
|
|
|
|
|
-------------------------------------------------------------------------------
|
|
|
|
### Application scenario 3:
|
|
|
|
You can also use smartchart to make reports and embed reports in your application system
|
|
|
|
[embedded smartchart report getting started document](https://gitee.com/smartchart/smartchart/wikis/7.%E6%8A%A5%E8%A1%A8%E5%B5%8C%E5%85%A5/%E7%AE%80%E5%8D%95%E5%B5%8C%E5%85%A5 "Embedded smartchart report getting started document")
|
|
|
|
|
|
|
|
-------------------------------------------------------------------------------
|
|
|
|
### Application scenario 4:
|
|
|
|
If you are a developer of Django application, congratulations. It can be a seamless part of your project
|
|
|
|
The functions of data visualization, dashboard and low code API development platform are instantaneous
|
|
|
|
[getting started with smartchart in Django](https://gitee.com/smartchart/smartchart/wikis/8.Django%E5%BA%94%E7%94%A8/%E5%B5%8C%E5%85%A5Django%)
|
|
-Django novices recommend downloading this project
|
|
```shell script
|
|
Please download the gitee / GitHub project directly
|
|
pip install smartchart
|
|
Startup method: Python manage py runserver
|
|
Account number: admin / Admin
|
|
```
|
|
------------------------------------------------
|
|
### Database support description
|
|
Smartchart can theoretically support any data source ,Mysql, SQLite, API and Excel data are supported by default. You can use Python connector to extend any data source
|
|
- SQL server requires PIP install pymssql
|
|
- Oracle needs to install PIP install Cx_ Oracle
|
|
- GP, postgrep needs to install PIP install psychopg2
|
|
- PIP install impyla is required for impala
|
|
- DB2 requires PIP install IBM_ db
|
|
- Python requires PIP install pandas, openpyxl
|
|
- ....
|
|
|
|
|
|
### Contact us for help
|
|
You can also join QQ group to discuss common problems
|
|
**QQ group: 476715246 Code: smartchart**
|
|
-------------------------------------------------------------------------------
|
|
#### Change Log
|
|
```shell script
|
|
2020 / 12 / 14 static resource localization
|
|
v3. 9.8.2 support all common databases, Vue and datav
|
|
v3. 9.8.7 support Jupiter, one click sharing and application of dashboard template
|
|
v3. 9.8.9 account binding function online
|
|
v3. 9.8.10 user defined graphics management online
|
|
v3. 9.8.17 support the latest echarts5 0, optimize loading speed
|
|
v3. 9.8.20 user defined graphics management function upgrade
|
|
v3. 9.8.23 echarts upgrades to 5.0.1, which supports multiple queries corresponding to one dataset and resource localization
|
|
v3. 9.9.0 print function optimization, new pivot function, personal static resource path display, DB2 support
|
|
v3. 9.9.1 development interface beautification
|
|
v3. 9.9.5 optimize the development interface, fix regularly refresh the bug, add and delete batch datasets
|
|
v3. 9.9.7 add Python connector, data pool, customize main template and optimize development interface
|
|
v3. 9.9.10 you can write CSS in div settings, add built-in dynamic tables, optimize layout support, and add config files
|
|
v3. 9.9.12 optimize background data processing performance and jupyter experience
|
|
v3. 9.9.16 add template editing function, add embedded report token mode, optimize editing interface and connection pool selection
|
|
v3. 9.9.18 fix Vue bug, add elementui support and optimize datav development experience
|
|
v3. 9.9.24 add editing function in the template development interface, automatically create data set, add data set test function, and upgrade echarts to 5.2
|
|
v3. 9.9.25 add the prompt of unsaved changes, select and execute the dataset, and optimize the repeated submission of the saved template
|
|
v3. 9.9.28 admin adaptation UI, resource file optimization
|
|
v3. 9.9.33 add file upload function, add basesimple template and optimize development menu
|
|
v4. 0
|
|
-Cancel the bootstrap layout, adopt a new 24 grid or 12 grid layout, smaller file references and more convenient functions
|
|
-Add drag and drop layout without losing the free development mode, which can be mixed
|
|
-Add HTML component to distinguish it from dataset component
|
|
-A more user-friendly home page and a new UI experience automatically identify users and developers
|
|
-Optimize the development menu and enhance the user development experience
|
|
-The front-end development interface and background data set synchronization are completed
|
|
v5. 0
|
|
-Newly developed UI experience and optimized drag and drop
|
|
-Remove the bootstrap completely and reduce the installation package
|
|
-All 40 graphic themes are open
|
|
-New custom theme development function and new color palette
|
|
-Add embedded and pop-up window development switch
|
|
-Interface of linkage drilling
|
|
-Graphic editor optimization adds one click Import of common graphics
|
|
-Add template T3 compatible 3.0 Report
|
|
-Add data set development to set graphic linkage
|
|
-Add data set development to set cache and timing
|
|
-Adding data set development can be converted into shared data set with one click
|
|
v5. one
|
|
-Add offline initialization dB and add dataset external service API configuration
|
|
-Optimize static resources and add VIP template function
|
|
-Add one key to scroll tables and pictures, rotate graphics, and add one key to achieve border effect
|
|
-The enhanced experience removes the default loading of map JS, and all unusual JS are changed to dynamic loading
|
|
```
|