[Wiki](https://gitee.com/smartchart/smartchart/wikis/pages) \|
[Community](https://www.smartchart.cn/) \|
[Sponsors](https://www.smartchart.cn/) \|
[GitHub](https://github.com/JohnYan2017/Echarts-Django) \|
[Gitee](https://gitee.com/smartchart/smartchart)

A platform that Connect Data to Echarts.
https://www.smartchart.cn


-------------------------------------------------------------------------------
[**English Documentation**](README-EN.md)
-------------------------------------------------------------------------------
### 简介
- SmartChart基于Echarts/Django的微代码开发平台,适用于任何WEB项目
- 简单, 敏捷, 高效,通用化, 高度可定制化, 让你的项目瞬间档次提升, 比拖拽开发更方便
- 完全真正打通前后端, 图形数据联动, 筛选开发毫无压力, 支持几乎常见的所有数据库
- 积木式的开发模式, 开箱即用, 安装简单, 依赖少, 适应各种平台
- 我们让简单和通用化不再是个矛盾体, Like it Star it


### 样列
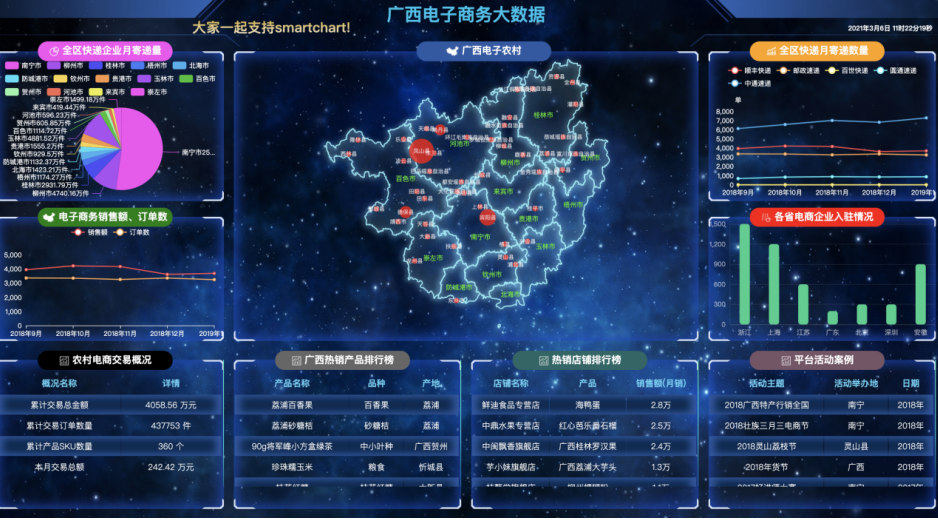
- [SmartChart大屏样列-智慧城市_大数据大屏](https://www.smartchart.cn/echart/?type=智慧城市_大数据大屏 "大屏样列-智慧城市_大数据大屏")
- [SmartChart集成DataV](https://www.smartchart.cn/echart/?type=Smartchart_DataV "集成DATAV")
- [Smartchart图形数据联动](https://www.smartchart.cn/echart/?type=评论分析 "图形数据联动")
- [Smartchart无关重要的视屏](https://www.ixigua.com/6910413586208653837?id=6910161770221044237 "smartchart")
- [Smartchart与Jupyter](https://www.ixigua.com/6910413586208653837?id=6912682016601440772 "smartchart")
### 快速开始
#### 安装Python环境
- 环境准备: 官方[最新Python下载链接](https://www.python.org/downloads/release/python-390/ "最新Python下载链接")
如果下载太慢, 可以到[淘宝镜象下载](https://npm.taobao.org/mirrors/python/3.9.0/ "淘宝镜象下载")
也可以直接下载[WINDOWS64位安装版](https://npm.taobao.org/mirrors/python/3.9.0/python-3.9.0-amd64.exe "WINDOWS64位安装版")
[MAC电脑安装版](http://npm.taobao.org/mirrors/python/3.9.0/python-3.9.0rc2-macosx10.9.pkg "MAC电脑安装版")
- [Window平台安装视屏介绍](https://www.ixigua.com/6910413586208653837?id=6901867671193649668 "Window平台安装视屏介绍")
**注意: Windows安装Python时需选中"Add to Path"**
#### 安装SmartChart
```shell script
pip3 install smartchart
如果安装过程慢,建意使用
pip3 install -i https://pypi.tuna.tsinghua.edu.cn/simple smartchart -U
升级方法:
pip3 install smartchart -U (升级)
```
### 应用场景一: 快速启动, 独立平台使用(推荐!)
```shell script
本地命令行启动:
smartchart
如果你是服务器部署,远程访问,服务端启动方式:
smartchart runserver 0.0.0.0:8000 --insecure
```
**管理员帐号密码: admin/admin, 请及时更改密码**
**开发前请 观看视屏说明!!! 重要!! 重要!!**
- [Smartchart数据库与数据集SQL](https://www.ixigua.com/6910413586208653837?id=6902584882958959116 "SQL")
- [Smartchart页面快速布局](https://www.ixigua.com/6910413586208653837?id=6907784122065191438 "布局")
- [Smartchart数据库与图形的对话](https://www.ixigua.com/6910413586208653837?id=6910373199603565063 "布局")
- [SmartChart大屏模板转化](https://www.ixigua.com/6910825442245083660/ "模板")
- [SmartChart最新开发界面](https://www.ixigua.com/6936381900768412198/ "开发界面")
-------------------------------------------------------------------------------
### 应用场景二: 在python,Jupyter中作为数据分析使用
**支持像pyecharts,Matplotlib等python绘图工具一样在Jupyter中使用, 更加方便, 更加炫酷**
**仅仅只有两个命令,get and set, 简化数据分析工作**
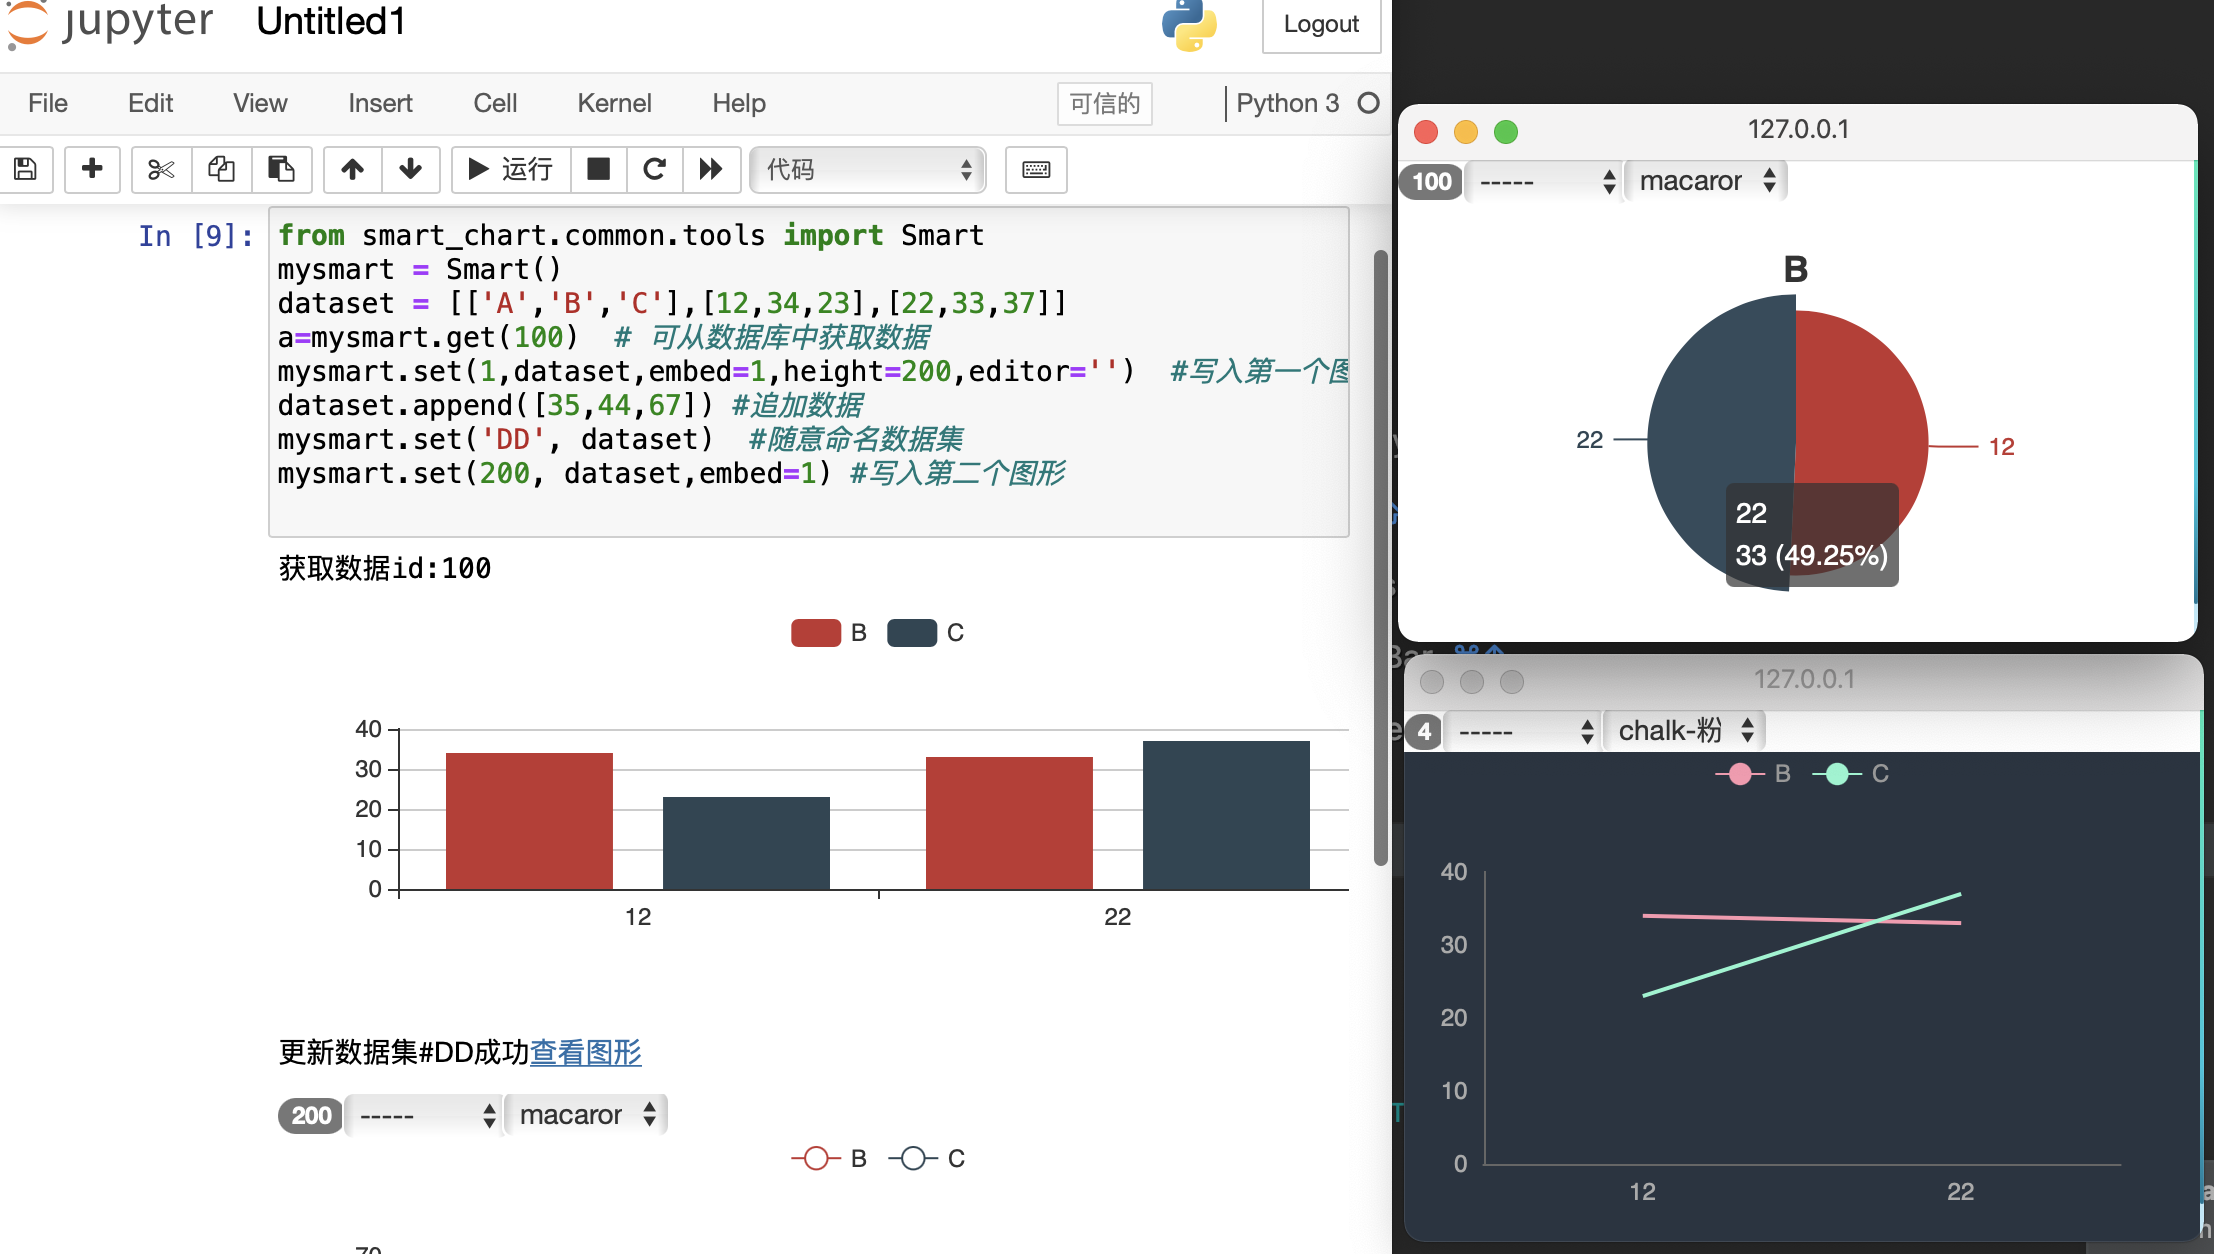
- [Smartchart与Pandas](https://www.ixigua.com/6910413586208653837?id=6918162479646245389 "smartchart")
- [Smartchart与Jupyter](https://www.ixigua.com/6910413586208653837?id=6917989046132310535 "smartchart")
- [SmartChart大屏新思路](https://www.ixigua.com/6921133676189352456 "smartchart")
- [SmartChart的Python连接器](https://www.ixigua.com/6944159294069670437 "smartchart")
```python
from smart_chart.common.tools import Smart
mysmart = Smart()
dataset = [['A','B','C'],[12,34,23],[22,33,37]]
# 可从数据库中获取数据, id 为smarchart中的数据集id
a=mysmart.get(100)
#把数据写入数据集并显示图形
mysmart.set(1,dataset,embed=1,height=200,editor='')
dataset.append([35,44,67]) #追加数据
#随意命名数据集, 不一定需要smartchart中数据集已有的
mysmart.set('DD', dataset)
mysmart.set('barxxx', dataset) #显示柱形数, 另外还有linexxx, piexxx
####### dateset也可以直接是pandas的df ########
import pandas as pd
# 从数据集1中获取数据直接转成pandas df
df = pddf(1)
# 读取excel数据
df = pd.read_excel('manual_smartdemo.xlsx', 'sheet1')
#sample = df.sample(10)
#mysmart.set('df0', sample)
df1 = df.groupby('province').agg({'qty':'sum'}).reset_index()
mysmart.set('pie', df1)
####### 你也可以全局初始化设定 #######
mychart = Smart(width=xx, height=xx, embed=1, editor='')
# width, height指定图形嵌入显示的宽高
# embed 默认不嵌入, embed=1 嵌入, embed='' 不嵌入
# editor 是否显示图形菜单
# push 是否持久化数据集 push=1, 无则新建有则保存数据
# url 报表访问的url,默认是localhost
```
-------------------------------------------------------------------------------
### 应用场景三: 外部系统对接方式
```python
# 如果需要,你可以采用单点登录的方式与smartchart进行对接嵌入
'/echart/smart_login?id=xxx&stamp=xxx&token=xxx&url=/'
'''
参数说明:
id: 用户名(在smartchart平台中管理)
stamp: 时间戳(1970年1月1日到生成时间的毫秒数)
token: 采用sha1加密, token=SHA1(链接秘钥+stamp+id)
链接秘钥默认smartchart,
请在环境变量设定SMART_KEY替换(重要)
url: 登录成功后跳转链接
'''
# 提示:为了数据安全,对外生产环境使用,务必设定你的环境变量SMART_KEY
```
-------------------------------------------------------------------------------
### 应用场景四: 在django项目中当作apps使用
**django新手不建意使用此方法**
- 最简单的方法(推荐!!!!)
```shell script
请直接下载gitee/github的项目后
pip install smartchart
启动方式 python manage.py runserver
帐号: admin/amdin
```
- 如果你动手能力强, 对django熟悉的, 可以参考Wiki中的说明进行自行加入
### 数据库支持说明
- 原生支持的有mysql,sqlite,API,EXCEL数据, 你可以使用python连接器扩展任意数据源
- SQL Server 需安装 pip install pymssql
- ORACLE 需安装 pip install cx_Oracle
- GP,Postgrep 需安装 pip install psycopg2
- Impala 需安装 pip install impyla
- DB2 需安装 pip install ibm_db
- Python 需安装 pip install pandas, openpyxl
- ....
### 联系我们与帮助
**安装及使用问题,可加以下微信号拉你入群**
 你也可以加入QQ群进行普通问题讨论
**QQ群: 476715246 暗号: smartchart**
-------------------------------------------------------------------------------
### 开发指引与声明:
**此项目为前端代码开源(需保留作者信息)**
```shell script
对应的项目目录说明:
templates/echart -- 编辑器界面
templates/index -- 首页Portal
static/echart -- 扩展前端数据处理函数(图形编辑中可用)
static/editor -- 编辑器界面js
static/index -- Portal对应js, css
static/custom -- 你可以在此新建人个文件夹存放自定义css, js, image ..
```
#### 声明
本项目后端个人可免费使用, 未经授权不可商用.
开发不易, 为了项目能长期维护下去, 禁止反编译、分发等行为.
#### Change Log
```shell script
2020/12/14 静态资源本地化
v3.9.8.2 支持所有常见数据库,支持VUE,DATAV
v3.9.8.7 支持Jupyter,支持一键分享和应用dashboard模板
v3.9.8.9 帐号绑定功能上线
v3.9.8.10 用户自定义图形管理上线
v3.9.8.17 支持最新的Echarts5.0, 优化加载速度
v3.9.8.20 用户自定义图形管理功能升级
v3.9.8.23 Echarts升级5.0.1, 支持一个数据集对应多查询, 资源本地化
v3.9.9.0 print函数优化,新增数据透视函数,个人静态资源路径显示, db2支持
v3.9.9.1 开发界面美化
v3.9.9.5 开发界面优化,fix定时刷新BUG,新增批量数据集删除
v3.9.9.7 增加python连接器,数据池,自定义主模板,优化开发界面
v3.9.9.10 DIV设定中可以写css,新增内置动态表格,优化布局支持,增加config文件
```
-------------------------------------------------------------------------------
### 更多使用说明:
**SmartChart designed for you / SmartChart是为你而生的一个产品,**
你只需要使用通用开发技术就可以使用, 因为她的通用性, 所以让你的知识不会因为改变而淘汰
因为她的灵活性, 你可以充分发挥你的智慧让她变得非常的Smart
抛弃繁琐的操作, 加速你的开发效率, 和BI产品相比, 如同Linux与Window的区别
- 开始使用smart chart, 您不需要任何专业知识, 无需coding, 选择模块组装即可!
- 但如果要使用好smart chart, 建意了解下javascript, H5, Echarts这些前端知识, 可以让你的应用更加得心应手,创作更炫的效果
- 如果你需要更进一步订制你的数据, 你需要了解下SQL的使用,本项目高级应用语言都是通用的技能, 象js, h5,sql 学习成本低
- [SmartChart入门文档入口, 以视屏为准](https://www.smartchart.cn/blog/article/2019/6/1/3.html "SmartChart入门")
你也可以加入QQ群进行普通问题讨论
**QQ群: 476715246 暗号: smartchart**
-------------------------------------------------------------------------------
### 开发指引与声明:
**此项目为前端代码开源(需保留作者信息)**
```shell script
对应的项目目录说明:
templates/echart -- 编辑器界面
templates/index -- 首页Portal
static/echart -- 扩展前端数据处理函数(图形编辑中可用)
static/editor -- 编辑器界面js
static/index -- Portal对应js, css
static/custom -- 你可以在此新建人个文件夹存放自定义css, js, image ..
```
#### 声明
本项目后端个人可免费使用, 未经授权不可商用.
开发不易, 为了项目能长期维护下去, 禁止反编译、分发等行为.
#### Change Log
```shell script
2020/12/14 静态资源本地化
v3.9.8.2 支持所有常见数据库,支持VUE,DATAV
v3.9.8.7 支持Jupyter,支持一键分享和应用dashboard模板
v3.9.8.9 帐号绑定功能上线
v3.9.8.10 用户自定义图形管理上线
v3.9.8.17 支持最新的Echarts5.0, 优化加载速度
v3.9.8.20 用户自定义图形管理功能升级
v3.9.8.23 Echarts升级5.0.1, 支持一个数据集对应多查询, 资源本地化
v3.9.9.0 print函数优化,新增数据透视函数,个人静态资源路径显示, db2支持
v3.9.9.1 开发界面美化
v3.9.9.5 开发界面优化,fix定时刷新BUG,新增批量数据集删除
v3.9.9.7 增加python连接器,数据池,自定义主模板,优化开发界面
v3.9.9.10 DIV设定中可以写css,新增内置动态表格,优化布局支持,增加config文件
```
-------------------------------------------------------------------------------
### 更多使用说明:
**SmartChart designed for you / SmartChart是为你而生的一个产品,**
你只需要使用通用开发技术就可以使用, 因为她的通用性, 所以让你的知识不会因为改变而淘汰
因为她的灵活性, 你可以充分发挥你的智慧让她变得非常的Smart
抛弃繁琐的操作, 加速你的开发效率, 和BI产品相比, 如同Linux与Window的区别
- 开始使用smart chart, 您不需要任何专业知识, 无需coding, 选择模块组装即可!
- 但如果要使用好smart chart, 建意了解下javascript, H5, Echarts这些前端知识, 可以让你的应用更加得心应手,创作更炫的效果
- 如果你需要更进一步订制你的数据, 你需要了解下SQL的使用,本项目高级应用语言都是通用的技能, 象js, h5,sql 学习成本低
- [SmartChart入门文档入口, 以视屏为准](https://www.smartchart.cn/blog/article/2019/6/1/3.html "SmartChart入门")