[Wiki](https://gitee.com/smartchart/django_smartchart/wikis/pages) \|
[Community](https://www.smartchart.cn/) \|
[Sponsors](https://www.smartchart.cn/) \|
[GitHub](https://github.com/JohnYan2017/Echarts-Django) \|
[Gitee](https://gitee.com/smartchart/django_smartchart)

A platform that Connect Data to Echarts.
https://www.smartchart.cn


-------------------------------------------------------------------------------
[**English Documentation**](README-EN.md)
-------------------------------------------------------------------------------
## 简介
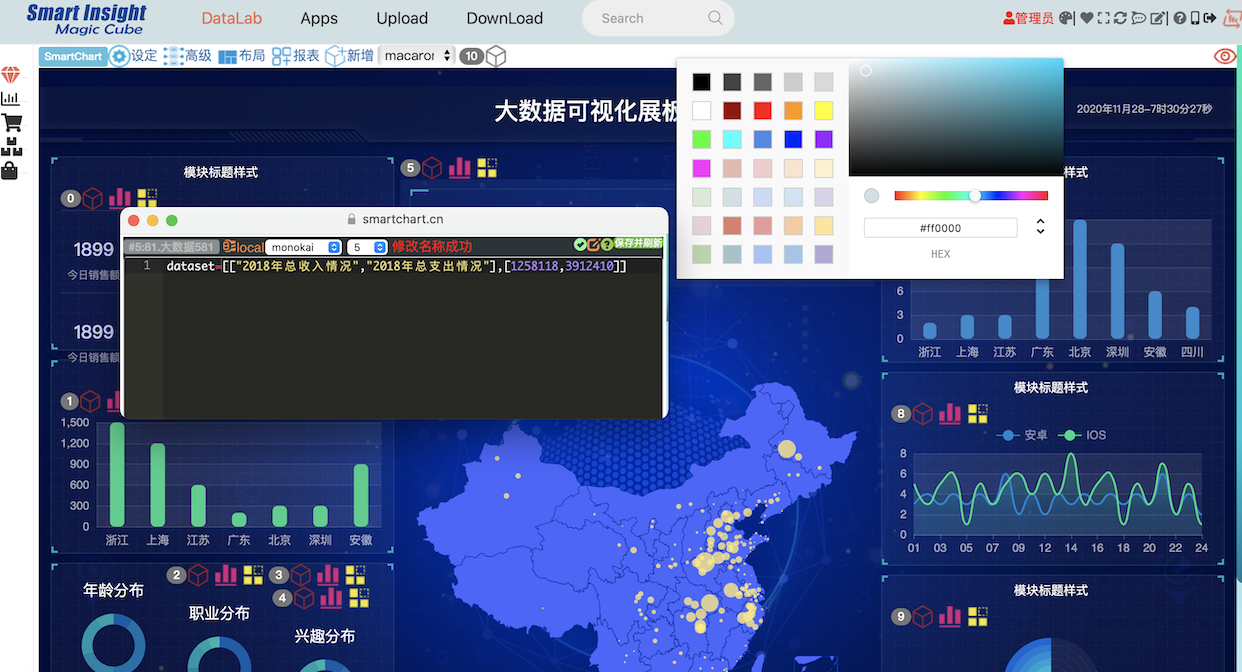
- SmartChart是基于Echarts的微代码开发平台,适用于任何WEB项目,比拖拽开发更方便
- 简单, 敏捷, 高效,通用化, 高度可定制化, 让你的项目瞬间档次提升
- 完全真正打通前后端, 图形数据联动, 筛选开发毫无压力
- 积木式的开发模式, 开箱即用, 安装简单, 依赖少, 适应各种平台
- 我们让简单和通用化不再是个矛盾体, 请加入我们共建生态, Like it Star it

### 安装使用说明:
- 环境准备: 官方[最新Python下载链接](https://www.python.org/downloads/release/python-390/ "最新Python下载链接")
如果下载太慢, 可以到[淘宝镜象下载](https://npm.taobao.org/mirrors/python/3.9.0/ "淘宝镜象下载")
也可以直接下载[WINDOWS64位安装版](https://npm.taobao.org/mirrors/python/3.9.0/python-3.9.0-amd64.exe "WINDOWS64位安装版")
[MAC电脑安装版](http://npm.taobao.org/mirrors/python/3.9.0/python-3.9.0rc2-macosx10.9.pkg "MAC电脑安装版")
- [Window平台安装视屏介绍](https://www.ixigua.com/6901867671193649668/ "Window平台安装视屏介绍")
#### 如果你是非Python语言的开发者
```shell script
你可以把smartchart当作服务来嵌入你的页面使用
1. 安装Python环境(参考上面的环境准备)
2. 命令行安装:
pip3 install smartchart
pip3 install smartchart -U (升级)
# Mac or Linux 初始化方法
3. 初始化DB, 命令行输入
smartchart makemigrations
smartchart migrate
4. 建立管理员帐号, 如果已有可忽略
smartchart createsuperuser
5. 本地命令行启动:
smartchart
如果你需要远程访问,启动方式:
smartchart runserver 0.0.0.0:8000 --insecure
6. 访问http://127.0.0.1:8000/echart/init_db/ 进行数据初始化
# Window 初始化方法
3. 初始化DB, 你需要找到你的python安装地址,不记得了参考下图方法
如C:\Users\xxx\AppData\Local\Programs\Python\Python39
命令行输入
cd C:\Users\....\Python39\Scripts\
python smartchart makemigrations
python smartchart migrate
4. 建立管理员帐号, 如果已有可忽略
python smartchart createsuperuser
5. 本地命令行启动:
python smartchart
如果你需要远程访问
启动方式:
python smartchart runserver 0.0.0.0:8000 --insecure
6. 访问http://127.0.0.1:8000/echart/init_db/ 进行数据初始化
```
**访问首页http://127.0.0.1:8000**
**开发前建意新建一个非超级管理员帐号(重要),避免改到内置的数据集和图形**
**并观看视屏说明!!!**
- [SQL与图形联动视屏教程](https://www.ixigua.com/6902584882958959116/ "SQL与图形联动视屏教程")
- [基础操作视屏教程](https://www.ixigua.com/6882218819964797447/ "基础操作视屏教程")
```python
# 如果需要,你可以采用单点登录的方式与smartchart进行对接嵌入
# 各种语言的对接源码可以在对应的xxxInterface中找到,欢迎PULL
'/echart/smart_login?id=xxx&stamp=xxx&token=xxx&url=/'
'''
参数说明:
id: 用户名(在smartchart平台中管理)
stamp: 时间戳(1970年1月1日到生成时间的毫秒数)
token: 采用sha1加密, token=SHA1(链接秘钥+stamp+id)
链接秘钥默认smartchart,
请在环境变量设定SMART_KEY替换(重要)
url: 登录成功后跳转链接
'''
```
**提示:为了数据安全,对外生产环境使用,务必设定你的环境变量SMART_KEY**
#### 如果你是python开发者,可以在django项目中当作apps使用
```shell script
pip install smartchart
简单配置一下, 你可以参考此demo
1. 在你的setting.py的INSTALL_APPS中加入'smart_chart.echart'
2. MIDDLEWARE 中注释掉XFrameOptionsMiddleware
3. setting.py中设定为中国时区, 支持中文基础平台建设!
LANGUAGE_CODE = 'zh-hans'
TIME_ZONE = 'Asia/Shanghai'
USE_I18N = True
USE_L10N = True
USE_TZ = False # 此处必须为False
4. 在你的url.py中加入引用
from django.conf.urls import include
from django.views.generic import RedirectView
5. url.py的urlpatterns中加入路由
path('echart/', include('smart_chart.echart.urls')),
path('', RedirectView.as_view(url='echart/index/')), #首页,可自定义路由
6. 初始化DB, 命令行输入:
python manage.py makemigrations
python manage.py migrate
7. 建立管理员帐号, 如果已有可忽略
python manage.py createsuperuser
8. 启动服务
python manage.py runserver
9. 访问http://127.0.0.1:8000/echart/init_db/ 进行数据初始化
```
##### 图形样列参考
- [SmartChart图形样列](https://www.smartchart.cn/echart/show/ "图形样列")
- [SmartChart仪表盘样列](https://www.smartchart.cn/index/ "项目样列")
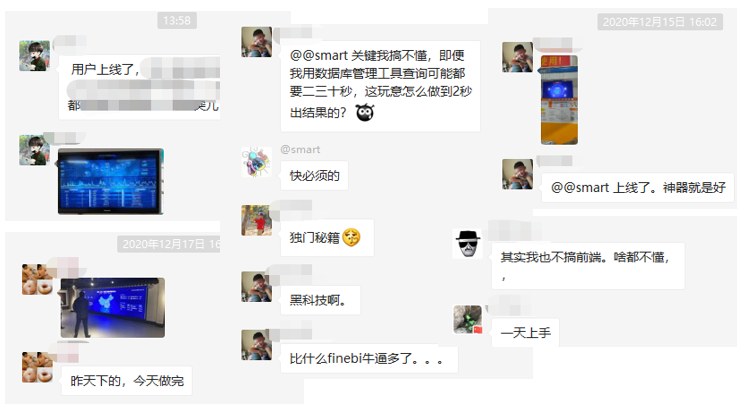
#### 安装及使用问题,微信群有时效性,加以下微信号拉你入群
 -------------------------------------------------------------------------------
### 开发指引:
**此项目为前端代码开源可商用(需保留作者信息)**
```shell script
对应的项目目录说明:
templates/echart -- 编辑器界面
templates/index -- 首页Portal
static/echart -- 扩展前端数据处理函数(图形编辑中可用)
static/editor -- 编辑器界面js
static/index -- Portal对应js, css
static/custom -- 你可以在此新建人个文件夹存放自定义css, js, image ..
CharResource -- 存放echarts转化后的smartchart
git clone 项目
pip install smartchart
启动方式 python manage.py runserver
帐号: admin/amdin
```
#### 声明
本项目使用的后端属于专有软件及代码,未获得授权的情况下,禁止进行反编译、分发等行为,否则将承担相应的法律后果
#### Change Log
```shell script
2020/12/14 静态资源本地化
TBD 初始友好化及VUE支持进行中
```
-------------------------------------------------------------------------------
### 更多使用说明:
SmartChart designed for you
SmartChart是为你而生的一个产品, 你只需要使用通用开发技术就可以使用,无需学习特定的技能, 因为她的通用性, 所以让你的知识不会因为改变而淘汰
因为她的灵活性, 你可以充分发挥你的智慧让她变得非常的Smart
抛弃繁琐的操作, 加速你的开发效率, 和BI产品相比, 如同Linux与Window的区别
她是一个数据集装箱, 让你非常方便的把数据组装起来后, 可使用统一的接口对外服务,支持系统间嵌入,实时,快速定制化开发. 你也可以理解为数据中台, 用可视化提供统一数据服务. 这是一个面向开发人员的平台, 实现数据的最后一公里
- 开始使用smart chart, 您不需要任何专业知识, 无需coding, 选择模块组装即可!
- 但如果要使用好smart chart, 建意了解下javascript, H5, Echarts这些前端知识, 可以让你的应用更加得心应手,创作更炫的效果
- 如果你需要更进一步订制你的数据, 你需要了解下SQL的使用,本项目高级应用语言都是通用的技能, 象js, h5,sql 学习成本低
#### 入门视屏说明(以下文字说明是之前版本,现已迭代多次,建意看视屏了解)
- [视屏教程一](https://www.ixigua.com/6902584882958959116/ "视屏教程一")
- [视屏教程二](https://www.ixigua.com/6887009904889070094/ "视屏教程二")
#### Smart Chart 基础
主要分为 数据连接池, 数据集, 图形格式, 页面模板, 主题, 组装盒(Dashboard)
- (数据集+图形格式) => 图形(report)
- (图形report+report+...) + 页面模板 + 主题 => Dashboard
#### 数据集
数据集可以理解为一个个的cube, 通过sql生成, 支持定时, 点频, 实时刷新的机制, 我们建意你用专业的工具开发sql 查询, 如navicate,datagrip,hue
数据集的高级用法, 参考如下链接 [数据集图形对应关系](https://www.smartchart.cn/blog/article/2019/7/9/10.html "数据集图形对应关系")
**对于一般用户来说, 无需了解如何生成数据集, 但建意了解以下数据集的常识**
数据集统一向图形传递数据的参数名为dataset, dataset是一个二维表结构, 如下
```python
dataset = [
['时间','人口','发展','潜力'],
['2018年', 12 , 10 , 9],
['2017年', 8 , 7 , 3],
......
]
```
#### 图形设定
smartchart内置了非常多的图形, 可以直接拿来使用, 但是要定制自已的样式, 建意稍作修改, 比如加上图形, 更改tips, 标题等等, 具体修改方式, 请参考[smartchart平台样列](https://www.smartchart.cn/echart/editor_min/?chartid=69 "smartchart平台样列")
如果你想进一步了解, 你可以参考 [自定义图形指南](https://www.smartchart.cn/blog/article/2019/8/21/14.html "自定义图形指南")
#### 模版
每一个div对应一个DIV格式, 可以比喻成给图形包一件衣服,我们会把图形绑定到这个容器中,你可以用它来设定容器的样式,如长宽高,边距,边框等等:
```html
```
**估计以让说明你有点不知如何下手, 建议先看最下方的视屏**
- [SmartChart入门](https://www.smartchart.cn/blog/article/2019/12/14/33.html "SmartChart入门")
- [组装Dashboard](https://www.smartchart.cn/blog/article/2019/6/7/7.html "组装Dashboard")
- [你的第一个模板](https://www.smartchart.cn/blog/article/2019/6/8/8.html "你的第一SMART CHART 模板")
- [数据集使用指南](https://www.smartchart.cn/blog/article/2019/7/9/10.html "数据集使用指南")
- [自定义图形指南](https://www.smartchart.cn/blog/article/2019/8/21/14.html "自定义图形指南")
- [模板开发指南](https://www.smartchart.cn/blog/article/2019/11/24/30.html "模板开发指南")
- [dashboard权限管理](https://www.smartchart.cn/blog/article/2019/9/13/17.html "dashboard权限管理")
- [图形简单联动指南](https://www.smartchart.cn/blog/article/2019/10/26/25.html "图形联动指南")
- [筛选器设计指南](https://www.smartchart.cn/blog/article/2019/10/21/24.html "筛选器设计指南")
- [联动钻取设计指南](https://www.smartchart.cn/blog/article/2019/10/27/26.html "钻取设计指南")
- [共享数据集指南](https://www.smartchart.cn/blog/article/2019/10/30/27.html "公用数据集指南")
- [动态播放效果](https://www.smartchart.cn/blog/article/2020/8/21/46.html "动态播放效果")
- [可视化设计工具](https://www.smartchart.cn/blog/article/2019/9/22/18.html "可视化设计工具")
- [图形在线调试](https://www.smartchart.cn/echart/editor/ "图形在线调试")
- [视屏教程一](https://www.ixigua.com/6887009904889070094/ "视屏教程一")
- [视屏教程二](https://www.ixigua.com/6882218819964797447/ "视屏教程二")
-------------------------------------------------------------------------------
### 开发指引:
**此项目为前端代码开源可商用(需保留作者信息)**
```shell script
对应的项目目录说明:
templates/echart -- 编辑器界面
templates/index -- 首页Portal
static/echart -- 扩展前端数据处理函数(图形编辑中可用)
static/editor -- 编辑器界面js
static/index -- Portal对应js, css
static/custom -- 你可以在此新建人个文件夹存放自定义css, js, image ..
CharResource -- 存放echarts转化后的smartchart
git clone 项目
pip install smartchart
启动方式 python manage.py runserver
帐号: admin/amdin
```
#### 声明
本项目使用的后端属于专有软件及代码,未获得授权的情况下,禁止进行反编译、分发等行为,否则将承担相应的法律后果
#### Change Log
```shell script
2020/12/14 静态资源本地化
TBD 初始友好化及VUE支持进行中
```
-------------------------------------------------------------------------------
### 更多使用说明:
SmartChart designed for you
SmartChart是为你而生的一个产品, 你只需要使用通用开发技术就可以使用,无需学习特定的技能, 因为她的通用性, 所以让你的知识不会因为改变而淘汰
因为她的灵活性, 你可以充分发挥你的智慧让她变得非常的Smart
抛弃繁琐的操作, 加速你的开发效率, 和BI产品相比, 如同Linux与Window的区别
她是一个数据集装箱, 让你非常方便的把数据组装起来后, 可使用统一的接口对外服务,支持系统间嵌入,实时,快速定制化开发. 你也可以理解为数据中台, 用可视化提供统一数据服务. 这是一个面向开发人员的平台, 实现数据的最后一公里
- 开始使用smart chart, 您不需要任何专业知识, 无需coding, 选择模块组装即可!
- 但如果要使用好smart chart, 建意了解下javascript, H5, Echarts这些前端知识, 可以让你的应用更加得心应手,创作更炫的效果
- 如果你需要更进一步订制你的数据, 你需要了解下SQL的使用,本项目高级应用语言都是通用的技能, 象js, h5,sql 学习成本低
#### 入门视屏说明(以下文字说明是之前版本,现已迭代多次,建意看视屏了解)
- [视屏教程一](https://www.ixigua.com/6902584882958959116/ "视屏教程一")
- [视屏教程二](https://www.ixigua.com/6887009904889070094/ "视屏教程二")
#### Smart Chart 基础
主要分为 数据连接池, 数据集, 图形格式, 页面模板, 主题, 组装盒(Dashboard)
- (数据集+图形格式) => 图形(report)
- (图形report+report+...) + 页面模板 + 主题 => Dashboard
#### 数据集
数据集可以理解为一个个的cube, 通过sql生成, 支持定时, 点频, 实时刷新的机制, 我们建意你用专业的工具开发sql 查询, 如navicate,datagrip,hue
数据集的高级用法, 参考如下链接 [数据集图形对应关系](https://www.smartchart.cn/blog/article/2019/7/9/10.html "数据集图形对应关系")
**对于一般用户来说, 无需了解如何生成数据集, 但建意了解以下数据集的常识**
数据集统一向图形传递数据的参数名为dataset, dataset是一个二维表结构, 如下
```python
dataset = [
['时间','人口','发展','潜力'],
['2018年', 12 , 10 , 9],
['2017年', 8 , 7 , 3],
......
]
```
#### 图形设定
smartchart内置了非常多的图形, 可以直接拿来使用, 但是要定制自已的样式, 建意稍作修改, 比如加上图形, 更改tips, 标题等等, 具体修改方式, 请参考[smartchart平台样列](https://www.smartchart.cn/echart/editor_min/?chartid=69 "smartchart平台样列")
如果你想进一步了解, 你可以参考 [自定义图形指南](https://www.smartchart.cn/blog/article/2019/8/21/14.html "自定义图形指南")
#### 模版
每一个div对应一个DIV格式, 可以比喻成给图形包一件衣服,我们会把图形绑定到这个容器中,你可以用它来设定容器的样式,如长宽高,边距,边框等等:
```html
```
**估计以让说明你有点不知如何下手, 建议先看最下方的视屏**
- [SmartChart入门](https://www.smartchart.cn/blog/article/2019/12/14/33.html "SmartChart入门")
- [组装Dashboard](https://www.smartchart.cn/blog/article/2019/6/7/7.html "组装Dashboard")
- [你的第一个模板](https://www.smartchart.cn/blog/article/2019/6/8/8.html "你的第一SMART CHART 模板")
- [数据集使用指南](https://www.smartchart.cn/blog/article/2019/7/9/10.html "数据集使用指南")
- [自定义图形指南](https://www.smartchart.cn/blog/article/2019/8/21/14.html "自定义图形指南")
- [模板开发指南](https://www.smartchart.cn/blog/article/2019/11/24/30.html "模板开发指南")
- [dashboard权限管理](https://www.smartchart.cn/blog/article/2019/9/13/17.html "dashboard权限管理")
- [图形简单联动指南](https://www.smartchart.cn/blog/article/2019/10/26/25.html "图形联动指南")
- [筛选器设计指南](https://www.smartchart.cn/blog/article/2019/10/21/24.html "筛选器设计指南")
- [联动钻取设计指南](https://www.smartchart.cn/blog/article/2019/10/27/26.html "钻取设计指南")
- [共享数据集指南](https://www.smartchart.cn/blog/article/2019/10/30/27.html "公用数据集指南")
- [动态播放效果](https://www.smartchart.cn/blog/article/2020/8/21/46.html "动态播放效果")
- [可视化设计工具](https://www.smartchart.cn/blog/article/2019/9/22/18.html "可视化设计工具")
- [图形在线调试](https://www.smartchart.cn/echart/editor/ "图形在线调试")
- [视屏教程一](https://www.ixigua.com/6887009904889070094/ "视屏教程一")
- [视屏教程二](https://www.ixigua.com/6882218819964797447/ "视屏教程二")